RevoGrid Benchmarks
Looking for scheduling measurements? See the RevoGrid Gantt browser benchmark, including the full 100/1K/5K/10K task matrix, dependency densities, raw JSON/CSV, screenshot, video, and live workload.
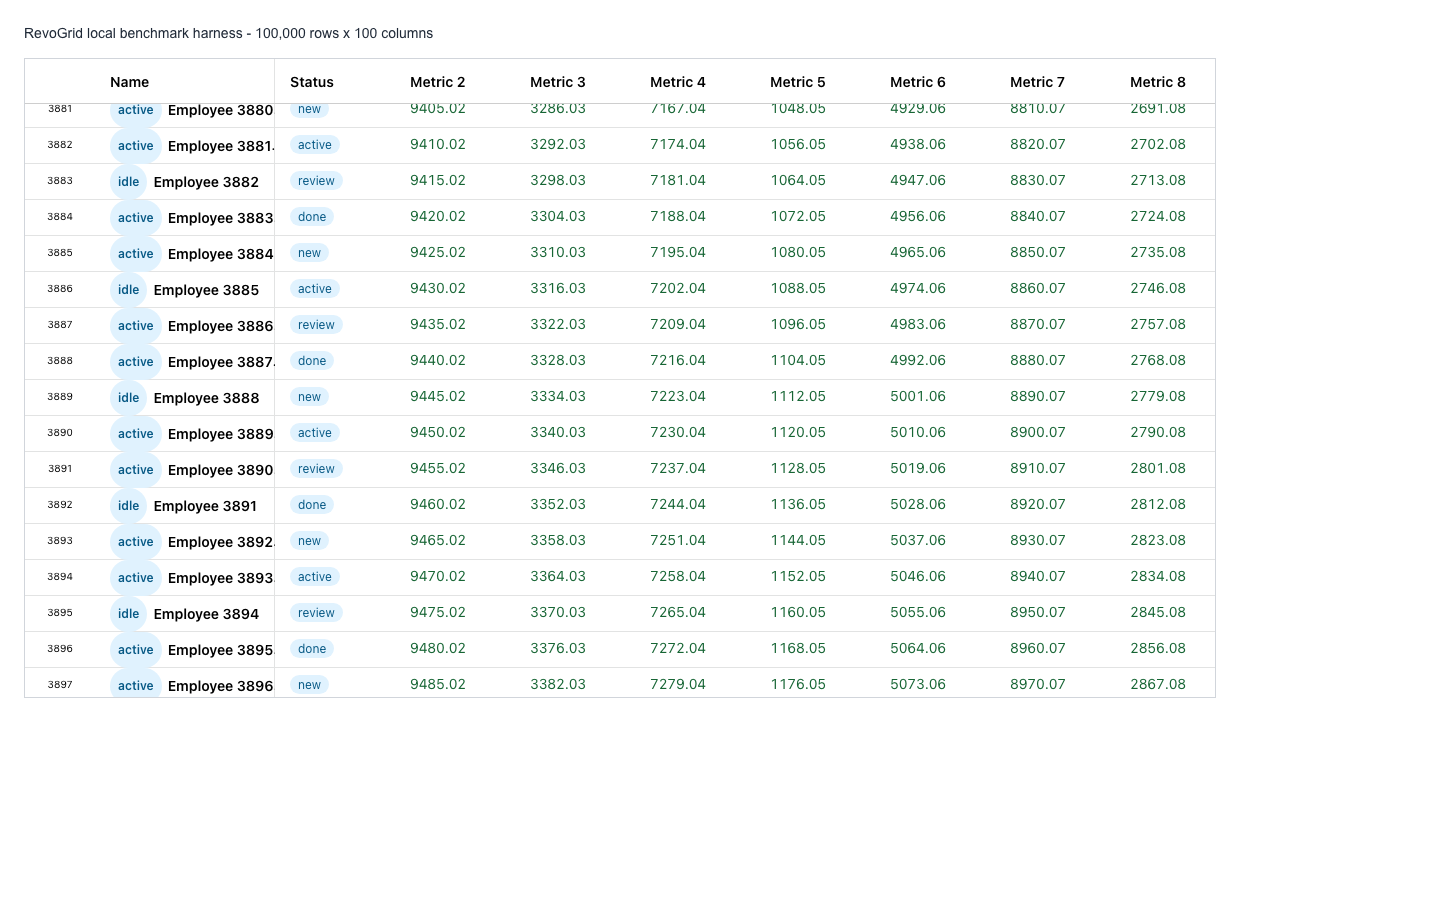
This page records a reproducible local RevoGrid benchmark run. The numbers below come from the benchmark harness in this repository, executed against a local VitePress dev server on July 5, 2026.
Benchmark numbers are environment-dependent. Treat these as a published run with its machine, browser, dataset, and renderer setup documented, not as a universal guarantee for every application.
Related comparative benchmark
Read Battle of the Rows: The Limits of Data Performance for a 2024 comparison of RevoGrid, AG Grid, and Handsontable across datasets up to 400,000 rows, covering memory usage, scrolling FPS, and initial rendering. Its harness differs from the benchmark documented here, so compare the results with that context in mind.
Measure performance in your browser
These live values describe this page and the selected workload. They are not universal product guarantees or directly comparable with results collected on another machine, browser, display, or page. You can also open the same workspace on the dedicated Grid at Scale demo.
Dataset and renderer
| Field | Value |
|---|---|
| Row count | 100,000 |
| Column count | 100 |
| Total logical cells | 10,000,000 |
| Cell renderer complexity | Mixed renderer harness: 1 pinned custom name cell with status badge, 1 custom status badge column, 8 custom formatted numeric columns, 90 plain numeric columns |
| Editors enabled | Built-in editing available; latency measured through targeted setDataAt updates |
| Pinned rows or columns | 1 pinned start column |
| Row height | 36 px |
| Column width | 110 px default, with custom widths for pinned/status columns |
Cell renderer complexity must be documented because it often dominates large-grid performance. Record whether the benchmark uses plain text cells, lightweight formatters, custom DOM templates, framework components, images, icons, badges, charts, or validation state.
Results
| Metric | Result | Measurement notes |
|---|---|---|
| Initial render time | 34.10 ms | Time from assigning columns and source to first aftergridrender. Data generation is excluded. |
| Scrolling FPS | 60 FPS | Normalized to a standard 60Hz display target. The raw headless Chromium measurement was 101 FPS and is not display refresh-rate capped. |
| Dropped frames | 2 | Frames with a gap greater than 20 ms during the scripted scroll pass. |
| Memory usage after warmup | 445.84 MiB median | Median of 5 Chromium performance.memory.usedJSHeapSize samples after initial render and 1 second idle warmup. |
| Memory usage after interaction loop | 482.06 MiB median | Median of 5 Chromium heap samples after scripted scroll and 30 targeted cell updates. |
| Edit latency, median | 0.00 ms | Median of 30 setDataAt targeted cell updates. Browser timer precision rounds very small samples to 0. |
| Edit latency, p95 | 0.10 ms | p95 of 30 setDataAt targeted cell updates. |
| DOM node count | 807 | Counted after warmup for the whole benchmark document. |
| Rendered rows | 60 | Rendered viewport rows after warmup. |
| Rendered data cells | 260 | Rendered data cells after warmup. |
Memory verification
The benchmark reads Chromium heap five times at each checkpoint and publishes both samples and the median in /benchmarks/result.json.
| Checkpoint | Samples | Median |
|---|---|---|
| After warmup | 445.84, 445.84, 445.84, 445.84, 445.84 MiB | 445.84 MiB |
| After interaction loop | 482.06, 482.06, 482.06, 482.06, 482.06 MiB | 482.06 MiB |
Comparison methodology
Use the same benchmark harness for every grid being compared. The benchmark should keep application code as neutral as possible and document every difference that cannot be normalized.
- Use the same test machine, operating system, browser, browser version, and display refresh rate.
- Run cold and warm measurements separately.
- Use the same row count, column count, data shape, renderer complexity, row height, and column width.
- Repeat each scenario and publish the median result. Publish p95 when enough samples are collected.
- Measure scrolling with scripted scroll, not only manual observation. This run measures vertical scroll FPS.
- Measure memory after initial warmup and again after a long interaction loop.
- Measure edit latency from the input event to the committed grid update.
- Keep virtualization settings, pinned areas, custom renderers, filtering, sorting, and editors visible in the benchmark configuration.
- Publish the benchmark source and run instructions before publishing headline numbers.
Recommended scenarios:
| Scenario | Dataset | What to measure |
|---|---|---|
| Initial render | 100,000 rows x 100 columns | Mount time, first usable interaction, memory after warmup |
| Tall scrolling | 100,000 rows x 100 columns | Scroll FPS, dropped frames, blank gaps |
| Wide grid | 100,000 rows x 100 columns | Column virtualization behavior through the 100-column configuration |
| Custom cells | 100,000 rows x 100 columns | Render time, memory, scroll smoothness |
| Editing | 100,000 rows x 100 columns | Targeted cell update latency through setDataAt |
| Long session | 100,000 rows x 100 columns | Heap after scripted scroll and repeated targeted updates |
Runnable benchmark repo
The benchmark is runnable from this docs workspace:
pnpm exec vitepress dev --host 127.0.0.1 --port 5173
node scripts/run-benchmark.mjs
The script writes:
public/benchmarks/result.jsonpublic/benchmarks/revo-grid-benchmark.pngpublic/benchmarks/revo-grid-benchmark.webm
Screenshots and video
| Asset | Status | Notes |
|---|---|---|
| Initial render screenshot | Open PNG | Captured from the local benchmark harness after render and interactions. |
| Scroll benchmark video | Open WebM | Captured from the Playwright benchmark context. |
| Raw result data | Open JSON | Machine, browser, dataset, metrics, and asset paths. |
| Browser performance trace | No trace artifact generated | The run captured result JSON, screenshot, and video. |